Corona Virus Feb 26th 2020 Market Update
Feb 26, 20202000 point drop on the DOW - within 2 days.
And that was right after the markets made new all time highs last week.
Why?
1. Multi-year Resistance Nodes kicked in.

2. WEEKLY DRPO Sell Signal + Weekly MACDP sell

3. Pandemic knocking on the door with COV19 ( S.Korea, Japan, Iran, Italy )

Do we need any more reasons for this selloff?
The technical picture clearly explains it.
The 'mystery sell off' started Friday - when CNBC anchors were commenting that there was no reason for the late sellof on Friday.
I have been commenting for weeks now - that the market is mis-reading the risks and potential impact of COV19 on the global economy - but we trade price, not fundamentals, as such I go long if technicals are bullish, I go short if technicals are bearish.
This reversal happened in 2 days - 2000 point drop - that is how fast market sentiment can change. For the causal investor/trader it cab be difficult to react if you were not prepared or mentally trained to react.
Every support node was disrespected on the way down.
Dynamic Pressure - Reaching A
Price action all the way down to the 5minute charts suggests a weak market.
What transpired - was that 2000 point down move.
Today we bounced almost 400 points near the market open, off what is significant support node at 3142. That bounce proved to be short lived, with the markets closing near the lows of the trading day down -123.77 points.
Given all the context above ( both higher time and lower timeframes ),
you can see that you want to be going short this market.
Our techniques gave us 2 great opportunities to enter on the short side today.
One near the open at OP f3 A resistance.
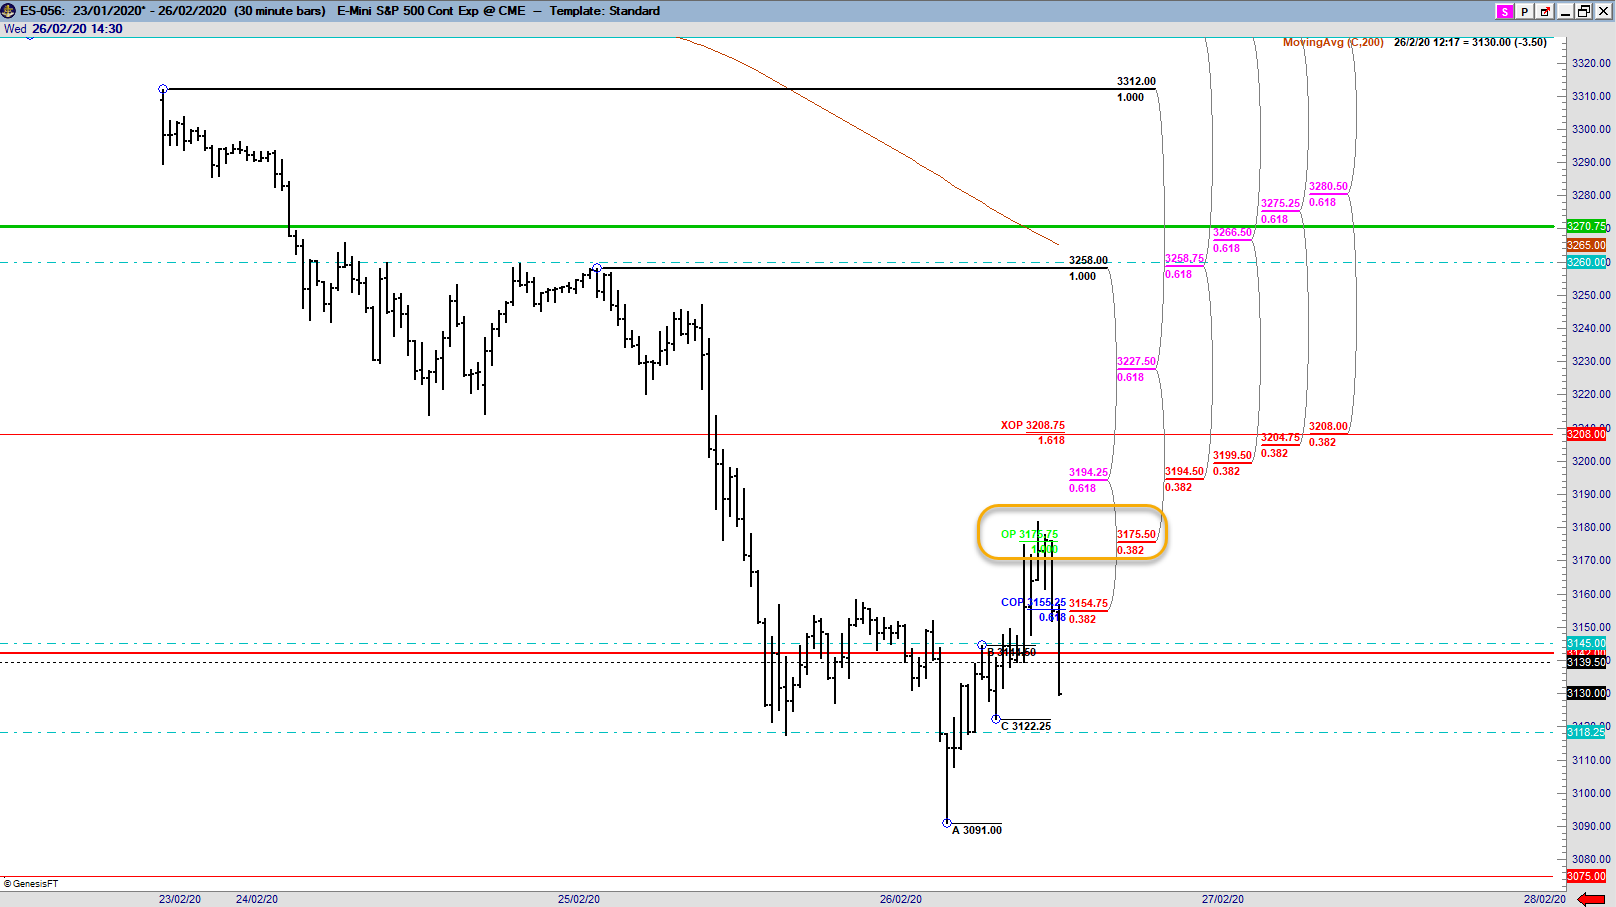
Another during the last hour of trading at K resistance.

The leading nature of our indicators - and the accuracy/consistency it allows us to nail market turning points - across multiple timeframes, continue to amaze me till this day. It simply works! At the time of writing this at 6:11pm, I booked my profits at COP F3 A ( 3098 ) after seeing support manifest.

Again, another turning point ( on 5 minute timeframe during low liquidity situations )

Anyways i expect markets to continue trading lower.
But I want to show you another important chart.

We are approaching the 200 moving average soon at 3056 price area.
Looking at the reactions off the 200ma in previous occasions.
I would expect some reaction off it, when we test it, likely on thursday - given the speed and extent of the down move, without any sort of relief rally.
Barring unexpected headline news on the COV19 situation, I'd expect a reaction off the 200ma. We also have some DiNapoli support nodes in the vicinity.
While the strength of the downmove is real - the markets are extremely oversold, and a relief rally is over due - and I think it could start from the 200MA.
If we break that - JESUS - lock your door, and run for cover.
What I can say for sure, is that Wallstreet will have its eye on the COV19 situation for the months ahead. Previously wallstreet totally ignored the COV19 outbreak as if it was a non event - new market highs.
Starting this week, Wallstreet can no longer do that.
That is why I approached my mentor Joe DiNapoli, to do a special webinar centered around the COV19 situation. We will be working on it together this weekend, and it should be made available to you very shortly.
We want to share our insights with you ( 40+ 12 years of active trading using DiNapoli levels )
Keep a look out for your inbox.
Stay safe
Joseph AuXano & the DiNapoli Trading Team
P.S. video recording gave a really good recap of everything that happened since last week.
P.P.S. the webinar will be epic!